
Taming randomness in ML models with hypothesis testing and marimo
The behavior of ML models is often affected by randomness at different levels, from the initialization of model parameters to the dataset split into training and evaluation. Thus, predictions made by a model are potentially different every time you run it.

The behavior of ML models is often affected by randomness at different levels, from the initialization of model parameters to the dataset split into training and evaluation. Thus, predictions made by a model (including the answers an LLM gives to your questions) are potentially different every time you run it. This makes evaluating models’ performance more complex than it might initially appear.
While academic papers almost always take into consideration the variability of model predictions in their evaluations, this is way less common in industry publications like blog posts or company announcements. As a consequence, verifying whether a new ML model is better than its predecessors from a table of published evaluation metrics can be a non-trivial task, one that does not depend on the metrics alone but on other parameters too, such as the number of experiments and the variability of their results.

This post is an introduction to hypothesis testing and how it can be used to compare results from different experiments (for instance, evaluations of different ML models) and draw conclusions that are supported by statistical evidence. You will learn this by running a marimo app in your browser, which will introduce you to the basics of statistical testing through different examples based on the simple concept of dice throwing. Using the marimo notebook will be the digital version of throwing more dice than you ever thought possible!
Determinism vs randomness
One of my favorite statistics books is Darrell Huff's "How to Lie with Statistics". Despite being published in 1954, it’s still highly relevant today in demonstrating how data can be misinterpreted to provide false interpretations – sometimes in good faith, sometimes not. For example, in Chapter 4 ("Much Ado about Practically Nothing"), Huff introduces the concept of sampling errors and how their presence makes some differences in data negligible in practice. He describes how Old Gold cigarette manufacturers purposely ignored the presence of these errors so they could advertise their brand as the one with the lowest amount of tar and nicotine. Now, if that reminds you of some LLM leaderboard or the latest paper providing a minor improvement over the state-of-the-art, you will understand why I find this 70-year-old book still so valuable!
The thing is, when the information you deal with is deterministic, you can easily compare different elements. If you represent different text documents as vectors (using any kind of representation, from bag-of-words to modern embeddings), you can determine which document is more similar to any other by calculating the distance between their respective vectors. Things become more complex when information is affected by randomness, and that is something which is happening more often than one would expect in the tech, AI, and industrial worlds. Examples include determining which of two machines works best by measuring the amount of defective items they produce; assessing which teaching approach is best by measuring students’ test scores; and of course finding which ML model performs best across a set of experiments.
To compare phenomena whose outcomes are stochastic, or that can be described by a random distribution, we use hypothesis testing. If you want to know more about the topic, this Wikipedia article provides a good general introduction to it. To find what this means in practice, let us work on a simple example: dice throwing.
Dice throwing with marimo
Years after passing the stats 101 exam with a report on statistics and cryptography (the paper itself being encrypted... in Italian!) I taught the same course to CS students. When confronted with the complexity of some topics in this course, I found that they always appreciated having concrete (and possibly simple) examples. Dice-throwing soon became one of my favorite examples: being very intuitive and easily explainable, it was applicable to different problems to provide the intuition of what was going on. I still keep the first version of my notes online and from time to time I point people to it.
Finding a good example is only half of the work needed to properly explain a topic. The other half is how you present it, and I think Seeing Theory was a great inspiration for me. If you are interested in learning more about basic probability and statistics, I strongly suggest you check out its visually stunning interactive demos.
Looking for a tool that would allow me to build something similar, I found marimo, a reactive, open-source Python notebook that is “reproducible, git-friendly, and deployable as scripts or apps”. One of the features I like the most is that you can run it entirely in your browser, in the form of WASM notebooks. This allows me to easily share all of its code, and you can run it without having to install anything. Add to this a very helpful documentation and a great community and you will understand why I had to try this!
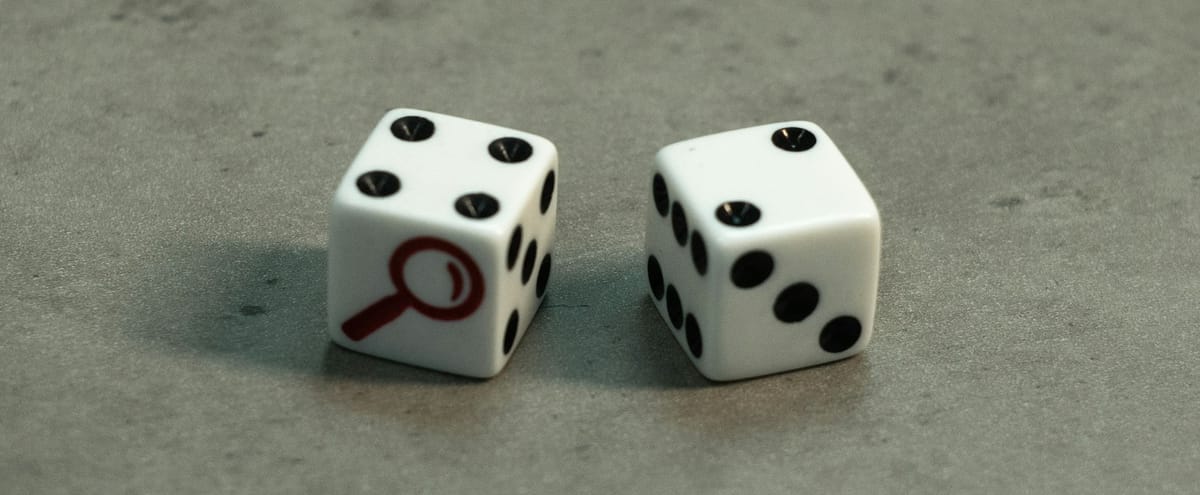
The outcome is a marimo notebook that works as a practical introduction to hypothesis testing. It starts with something as easy as simulating a single die throw, and guiding you through more and more advanced experiments (and a lot of virtual dice!) it will point you to the right questions to ask yourself whenever you are presented with a comparison between different ML models.
So, go to https://marimo.io/p/@mzai/on-hypothesis-testing follow the instructions and start playing with the notebook in your browser. The code is available but you can toggle it off from the three-dots menu you find on the top right corner. Have fun, and please feel free to reach out on Mozilla AI Discord or at my_first_name at mozilla.ai for questions, feedback, and requests.
Acknowledgements
Many thanks to Akshay Agrawal and Myles Scolnick for building marimo and providing help and super early feedback, Vicki Boykis and Oleg Lavrovsky for testing the notebook and offering me great suggestions on how to improve it.


